Ever found yourself gazing at stock market charts, trying to discern patterns, much like searching for shapes in the clouds? Well, welcome to the world of technical analysis!
The Genesis of Technical Analysis
Technical analysis, in essence, is the art and science of forecasting future price movements based on past market data. It’s not about reading the news or analyzing a company’s fundamentals; it’s about spotting trends and patterns in price charts.
Core Principles
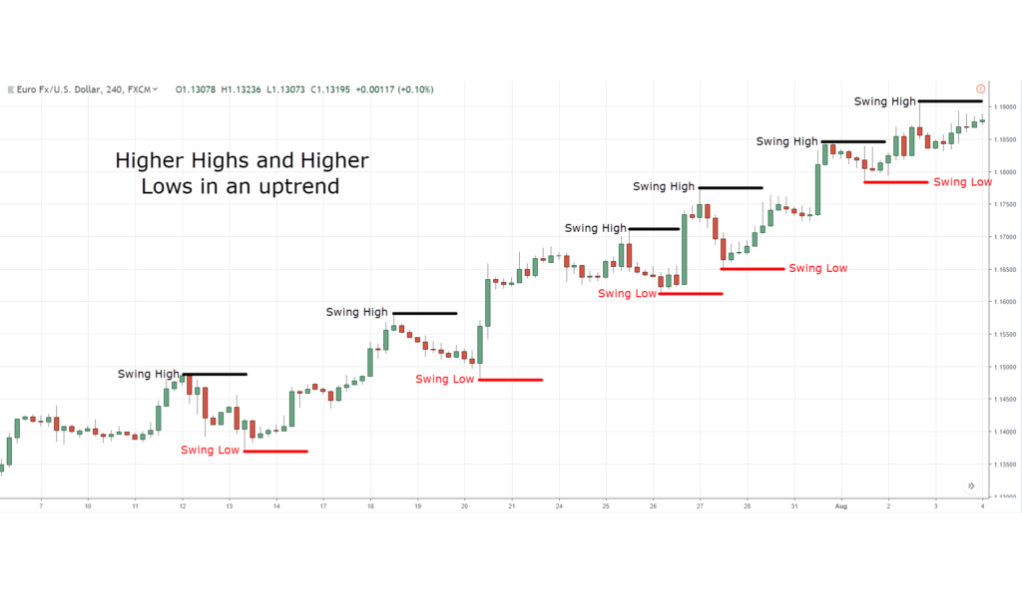
Two fundamental principles underline this approach: first, the market discounts everything, which means all information – public and private – is reflected in the price. Second, prices move in trends, be it an uptrend, downtrend, or sideways.
The Power of Chart Patterns
Stock market charts, at first glance, may seem like a bewildering maze of zigzag lines to the uninitiated. But, for those in the know, these lines are more than just random patterns; they are the pulse of the market, often indicating potential future movements.
Recognizing the Patterns
The stock market is a vast, dynamic tapestry of numbers, trends, and movements. To the untrained eye, it might seem like pure chaos, but with the right tools, one can decipher its intricate patterns and rhythms. Much like learning vocabulary when mastering a new language, recognizing chart patterns is fundamental to understanding the stock market’s narrative.
Interpretation and Application
In the vast and complex universe of the stock market, price charts and patterns function much like a foreign language, with each pattern conveying its own unique message. Grasping this language, however, requires more than just rote memorization of patterns—it demands interpretation, context, and application.
Popular Technical Indicators
To truly understand the narrative of the stock market, we can’t just rely on patterns alone. Much like how sentences need grammar to make sense, market analysis requires technical indicators to give depth and context. These indicators are the mathematical calculations based on price, volume, or open interest of a stock or contract.
Moving Averages
Ever heard of the term ‘smoothed out’? Moving averages do precisely that by averaging out price data, offering a clearer view of the trend. The two popular types are Simple Moving Average (SMA) and Exponential Moving Average (EMA).
Bollinger Bands
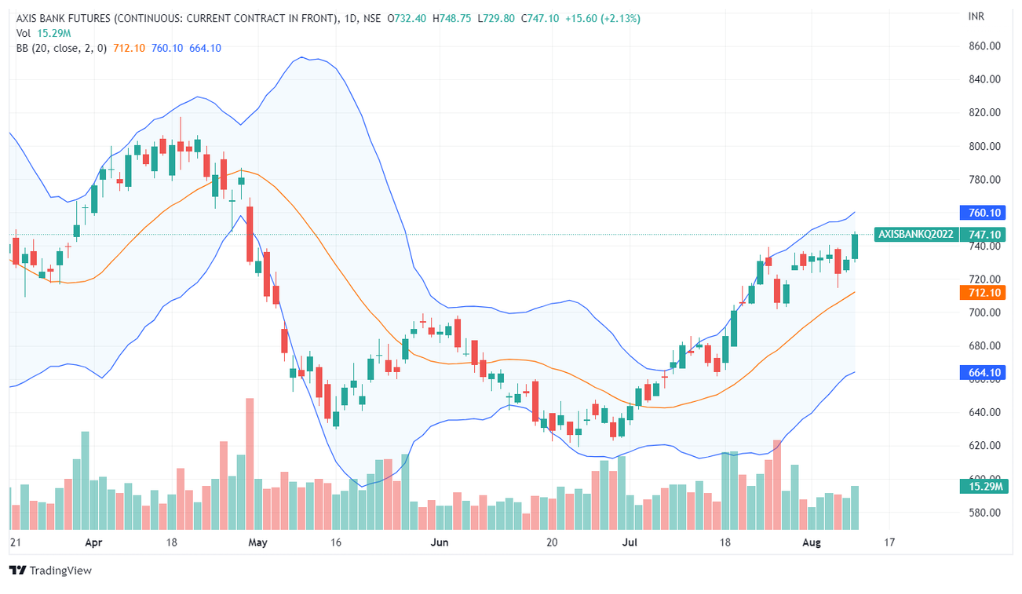
Picture this: a rubber band stretching and contracting. Bollinger Bands, in essence, show the volatility in price movement. When the bands contract, expect a sharp price move!
MACD (Moving Average Convergence Divergence)
Ever felt the tension before two rivals meet? MACD is somewhat like that, indicating when two moving averages are converging or diverging. It’s a momentum oscillator that can signal potential buy or sell opportunities.
The Magic of Combining Analyses
Would you trust a one-sided story? Probably not. When it comes to the complex world of investing, relying solely on either technical analysis or fundamental analysis can be akin to hearing only one side of a multifaceted tale. It’s the marriage of both analyses that often spells success for investors, offering a more balanced and comprehensive view.
Strengths of Technical Analysis
In the intricate landscape of the stock market, having an effective tool that aids in navigating potential investment opportunities is invaluable. Enter technical analysis—a method that acts like a GPS, guiding investors through the labyrinth of stock market movements.
The Role of Fundamental Analysis
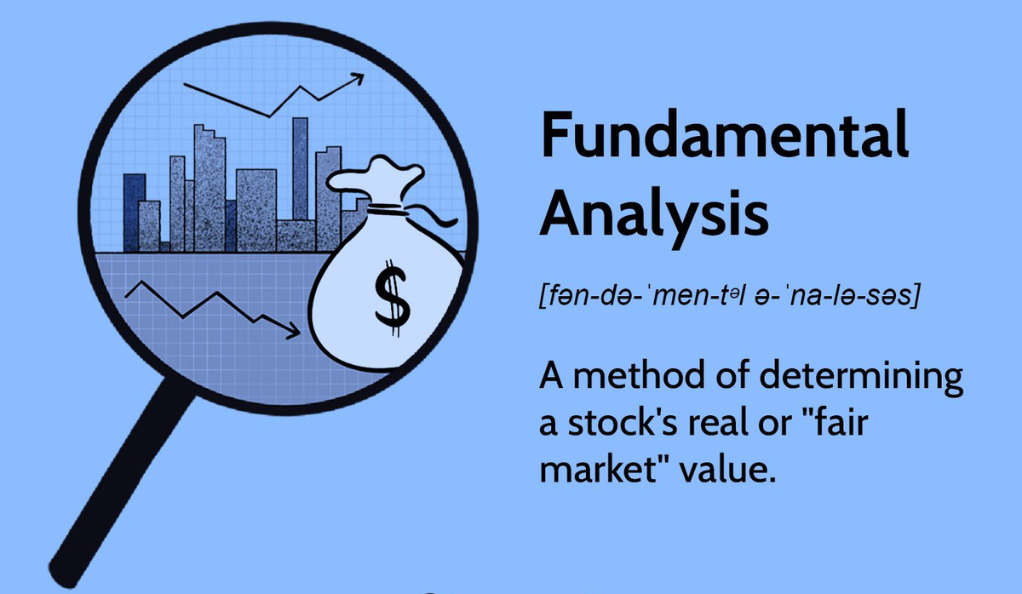
When navigating the world of investments, it’s easy to get swayed by the daily price movements, charts, and patterns. Yet, to truly understand the essence and potential of a stock, one must dive beneath the surface. This is where fundamental analysis shines, offering insights into the ‘why’ behind the ebb and flow of stock prices. It paints the broader canvas of a company’s story, giving investors the tools to decipher the bigger picture.
Integrative Approach
Just as a sailor depends on both a map and a compass to navigate the vast oceans, investors benefit immensely from the combined wisdom of both technical and fundamental analyses. This harmonious melding is what we refer to as the integrative approach, a strategy that brings together the best of both worlds, ensuring not a step is taken in the dark.
Conclusion
In the investing realm, technical analysis serves as a beacon, guiding through the often tumultuous seas of stock markets. However, one shouldn’t neglect the compass of fundamental analysis. By harmoniously combining both, investors stand a better chance at successful voyages.
FAQs
While technical analysis focuses on price patterns and trends, fundamental analysis delves into the financial health and performance of a company.
No indicator is 100% accurate. They should be used in conjunction with other tools and analyses.
Begin with understanding basic chart patterns and indicators. Numerous online resources and courses can guide you.
While many traders do, it’s advisable to combine it with fundamental analysis for a well-rounded strategy.
No, it can be applied to any market with historical price data, including forex, commodities, and cryptocurrencies.
Investdigital is committed to delivering unbiased and reliable information on subjects like cryptocurrency, finance, trading, and stocks. It's crucial to understand that we do not possess the capability to offer financial advice, and we actively encourage users to conduct their own comprehensive research.
Read More